If I were to somehow quantify the amount of time I spend on creating decks and then re-purposing them for different target audiences, you would think I'm in the Data Visualization and Story telling profession.
With excel and powerpoint being the most readily tools in the arsenal (in a professional setting); this blog is to help you elevate your story telling game. To tell a powerful story that sticks, it needs a few ingredients, a bit of McCandless intuition coupled with Wong's secret sauce:
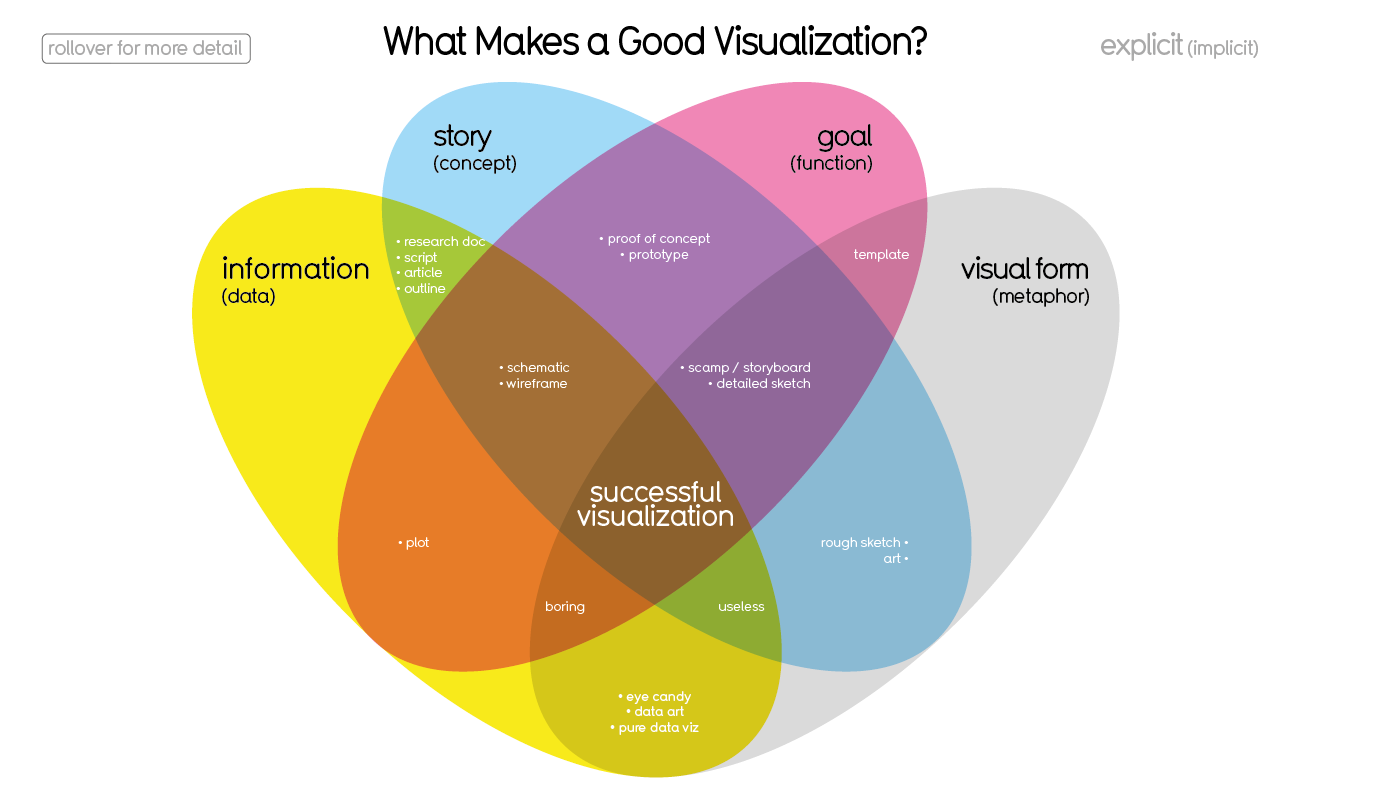 David McCandless's "Story Telling" framework:
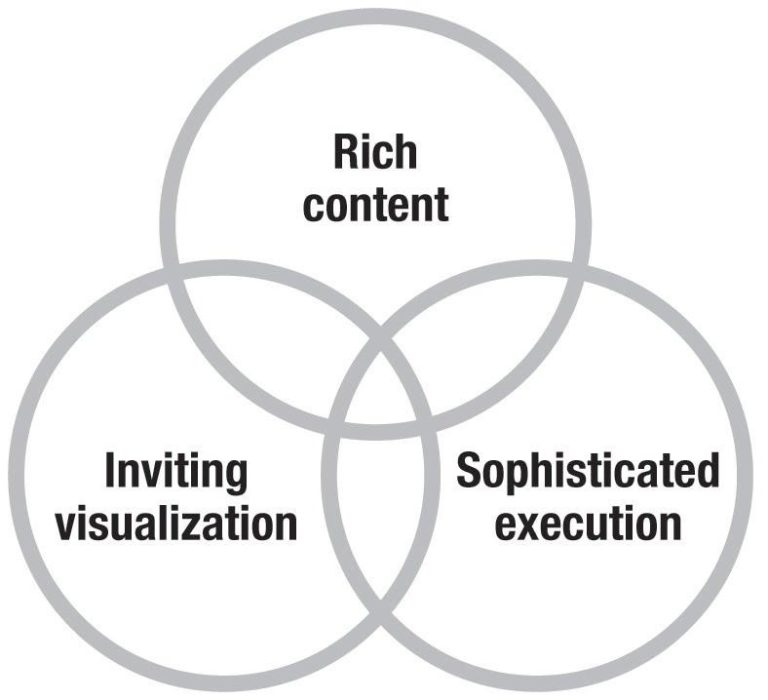
Dona Wong's "3 Elements" of Good Data visualization:

We are visual beings and studies suggest we process visual data & cues much faster than text. To influence the visual part of the brain (right side), understand your audience and create stickiness through context.
Leveraging these frameworks, you are now well off to create a story that connects your objective and goal with the audience. One thing to note is that, context sometimes gets missed, so use the all the "cues" at your disposal - but don't over do it. This art comes with time and practice.
Here's a practical example of to put all these concepts together: http://mmmahmood.blogspot.com/2019/06/a-practical-example-of-how-to-tell.html

0 Comments